Every developer knows the pain: The code compiles, the tests pass (mostly), but a bizarre edge case in production is causing the app to crash silently. You've spent two days looking at it. You are questioning your career choices.
This is where AI debugging transcends simple code completion.
1. The "Rubber Duck" on Steroids
The classic debugging technique is "Rubber Ducking"—explaining your code line-by-line to an inanimate object. AI takes this to the next level. By pasting your function and the stack trace into an AI and simply asking, "Explain to me what could cause this specific error path," the AI will often immediately spot the race condition or null pointer you went blind to.
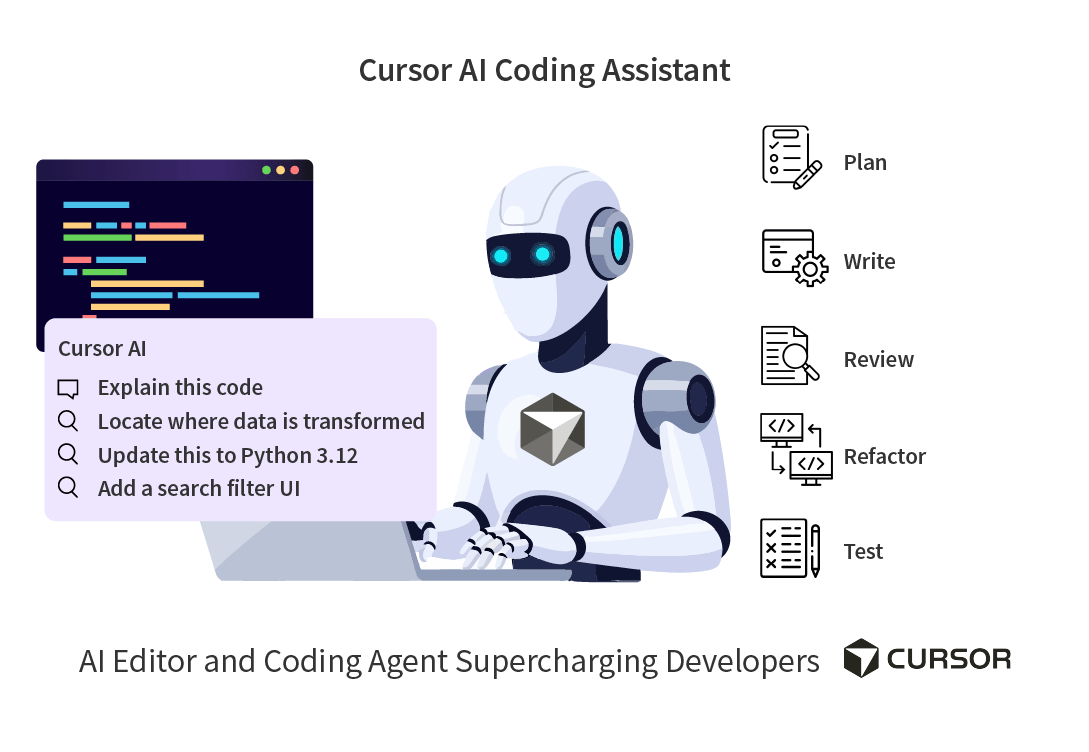
2. Using Cursor for Multi-File Context
The hardest bugs span multiple files. A state change in `Redux` causes a re-render in a `React` component, which triggers a duplicated API call. Generic chatbots fail here because they don't see the whole picture.
Using an AI IDE like Cursor, you can use the `@codebase` command to ask: "Trace the lifecycle of the user authentication token from the login API response to the local storage hook." The AI will read all connected files and point out exactly where the token is being overwritten.
Frequently Asked Questions (FAQ)
Can AI fix the bug for me automatically?
Often, yes. But you should never blindly copy-paste the fix. AI might fix the immediate crash by adding a null check, but in doing so, it might mask a deeper architectural flaw. Always review the "why" before accepting the "how."